Adding Charts & Graphs to Result Page of Your Outgrow Content
If you are looking to create a video advertisement cost calculator with a bar chart summarizing different costs per quality, you are in the right place. With our table-based graphing feature, you can easily create such a calculator. Let's get started!
How to get started with configuring the Graph
- Open the respective content in Build mode and navigate to the Results page.
- On the Results page, navigate to to Add Media section, and click on the Chart option.
.png")
- Our tables work just like any other spreadsheet. Start inputting numbers or variables in the cells, and the graph will start building automatically on the side. You can use variables from the calculator in the spreadsheet cells, like R1, R2, Q1, Q2, etc. When the graph is created for the end-user, it will automatically fetch the numbers for the variables.
.png")
NOTE: You can also click on Upload Excel, and can upload an existing Excel sheet that you might have containing all the required information.
Using Variables
The format to write the variables is slightly different. Instead of writing R1, you need to add an underscore. So it will be R_1 and Q_1.
Also, remember to add a "=" before referring to a variable.

- You can do most mathematical operations inside of the table.
.png")
- You can easily change the graph type by selecting it from the left panel. The graph will automatically adjust to take the numbers.

- Just click on the settings tab to make aesthetic changes like adding colours and grids, etc.

- Click on Insert Chart to add the chart on the Results page.
Important Note
Sometimes when Conditional Media is enabled on the results page, you will not be able to add Charts & Graphs, as Conditional Media only supports Images and Videos. You can turn off the Conditional Media setting, post which you will be able to see the option of adding charts and graphs.
Use JSON as a Data Source in your Chart
If you want to fetch data from an external JSON that contains currency rates, for example, you can use our JSON data source feature. Here's how to do it:
- Head to Charts or Tables on Result settings.
- Select JSON as the data source and enter your JSON feed URL. If the JSON is fetched properly, the JSON status will be connected, and you can add more columns to the right to add formulas. NOTE: Following is the URL with the JSON in the format acceptable on Outgrow: api.myjson.com/bins/zrbnz.
- If Auto Update is turned on the JSON data source, then every time the feed is refreshed, the formula will have to be defined again.
- You can use variables from the calculator in the spreadsheet cells along with JSON data, like R1, R2, Q1, Q2, etc. When the graph is created for the end-user, it will automatically fetch the numbers for the variables.
NOTE: If Auto Update is turned on the JSON data source then every time the feed is refreshed, the formula will have to be defined again. You can use variables from the calculator in the spreadsheet cells along with JSON data. So you can refer to variables like R1, R2, Q1, Q2, etc, and when the graph is created for the end-user, it will automatically fetch the numbers for the variables.
IMPORTANT NOTE
- To creare your JSON in the correct format, you can use tools like https://myjson.com/ .
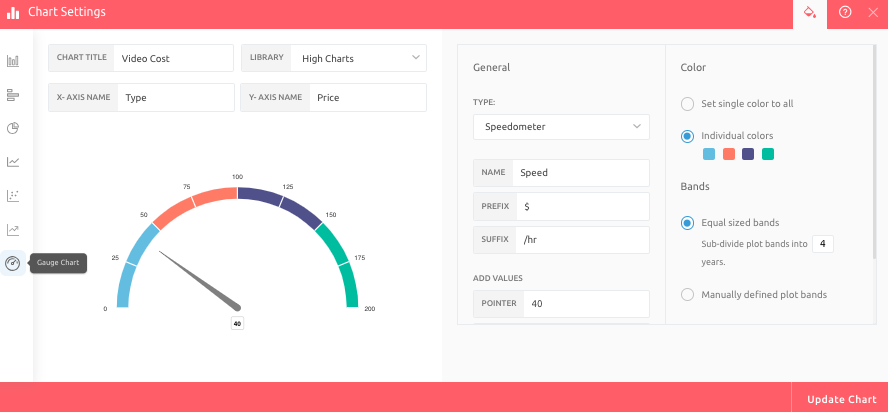
- Gauge Chart Visualization: Users can now enhance their results pages with Gauge Charts, providing a visually compelling representation of numerical data. This chart type allows for the display of values within a defined range, utilizing a speedometer-like interface to clearly indicate performance or progress. Users can customize the gauge with individual colors, bands, prefixes, suffixes, and pointer values, tailoring it to their specific data and presentation needs. This feature adds a dynamic and engaging way to present results, making it easier for users to understand and interpret key metrics.
Feel free to reach out to us at [email protected] and we will be happy to answer any question that you might have.
Updated over 1 year ago