Dashboard | Outgrow - Best Tool for Marketer
The first thing you will see after you log in is your Dashboard. Your Dashboard contains all your content pieces. If you still need to create a content piece, this is where you can start creating one. This is what the Dashboard looks like.
 (1).png")
You can create a new content piece from the Numerical calculator, Outcome quiz, Graded quiz, etc., under the Select a Content Type section.

All the published, as well as draft content pieces are listed here on your Dashboard. Your content pieces are displayed in the order of creation, with the most recently edited or created ones displayed first.
Dashboard Shortcuts
A. Clicking on the Options (3 horizontal dots) Icon on any content card reveals actions that can be performed on it directly from your Dashboard.
.png")
B. Under Global Analytics, you can get a bird's eye view of the analytics data for all content pieces.
 (1).png")
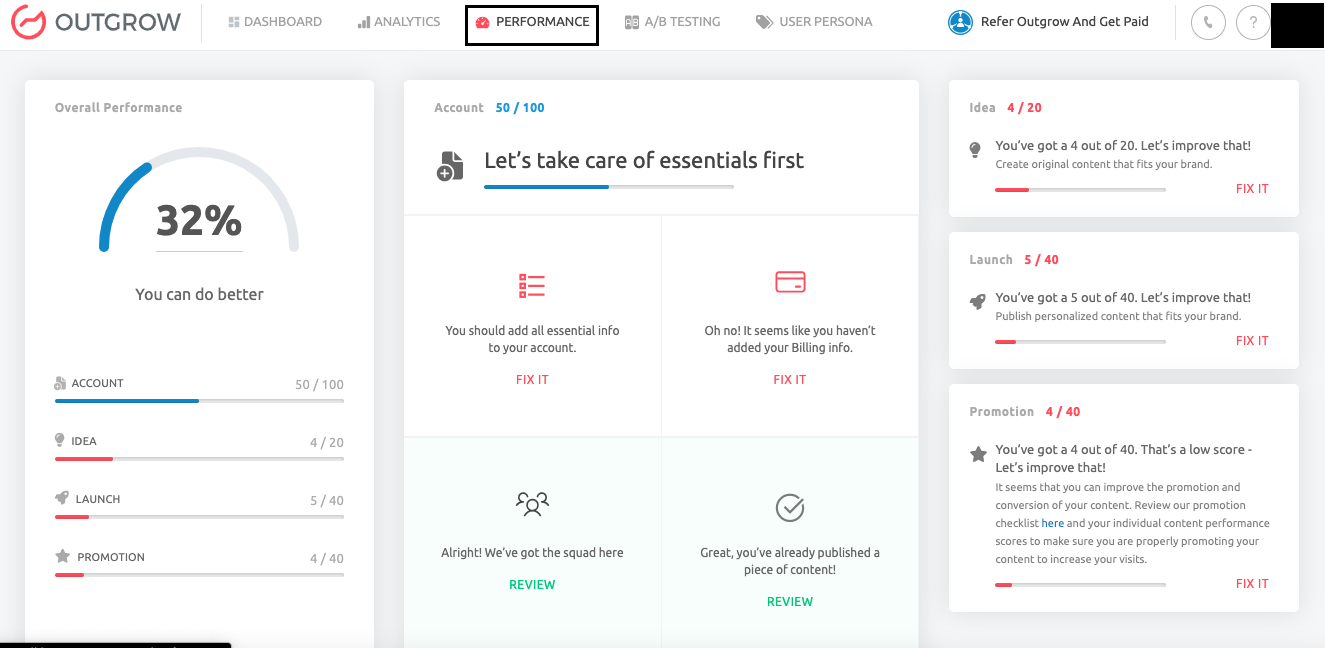
C. In the Performance section, you can see the overall performance of your Outgrow account. You can also get an idea of what your account needs to fix.
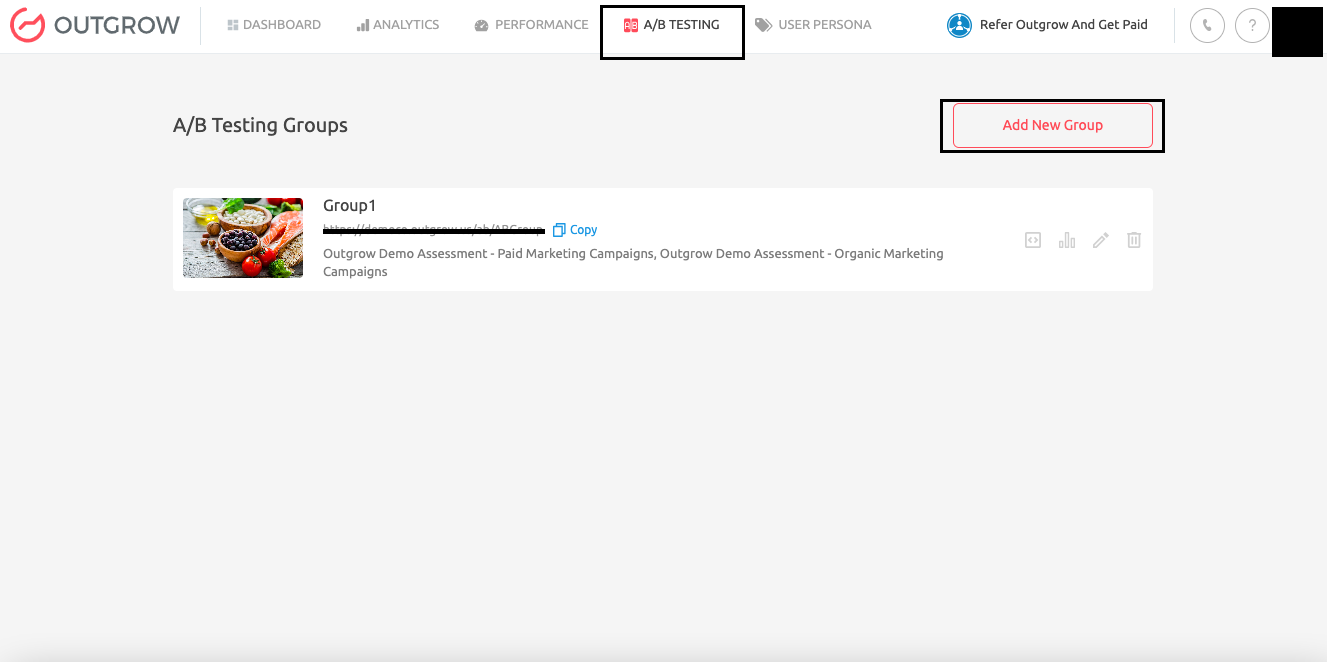
D. Under A/B Testing, you can create A & B versions of content and run a comparative analysis between the two versions to see which one is performing better.
E. In the User Persona section, you can create User Personas (Tags) that can be used to categorise the leads that you collect using Outgrow interactive content.
Managing multiple accounts
If you are an agency managing multiple clients, you will have multiple dashboards. You can switch from one client to another by selecting the company from the dropdown menu in the top right corner.

If you notice the docs are out of date or unclear, please don't hesitate to click on the "Suggest Edits" link! We're working to keep these docs up to date, however sometimes we get behind – and we'd love your help.
Updated about 2 years ago